
UK inflation is far too high, and the policy rate is far too low. That might sound odd, but if you look at the regime we’ve been in for more than seventeen years now, the statement makes perfect sense. Let me explain why.
Headline inflation in the United Kingdom came in at 3.8 percent in August. That kept the inflation rate at its highest level in more than a year and a half. It also meant inflation remained nearly twice as high as the Bank of England’s official target. The last time inflation came close to that target was almost a year ago, in October 2024.
If you look at inflation including “owner-occupiers’ housing costs,” the outcome was even worse—more than double the target. At 4.1 percent, this measure once again came in far too high. The last time it was near the Bank of England’s target was July 2021, when it stood at 2.1 percent. That’s more than four years ago.
What’s high?
Still, many investors and economists insist that the Bank of England’s policy rate is high. But that’s only true if they also acknowledge that we’re in a new regime, with new rules. Most of the time, they don’t.
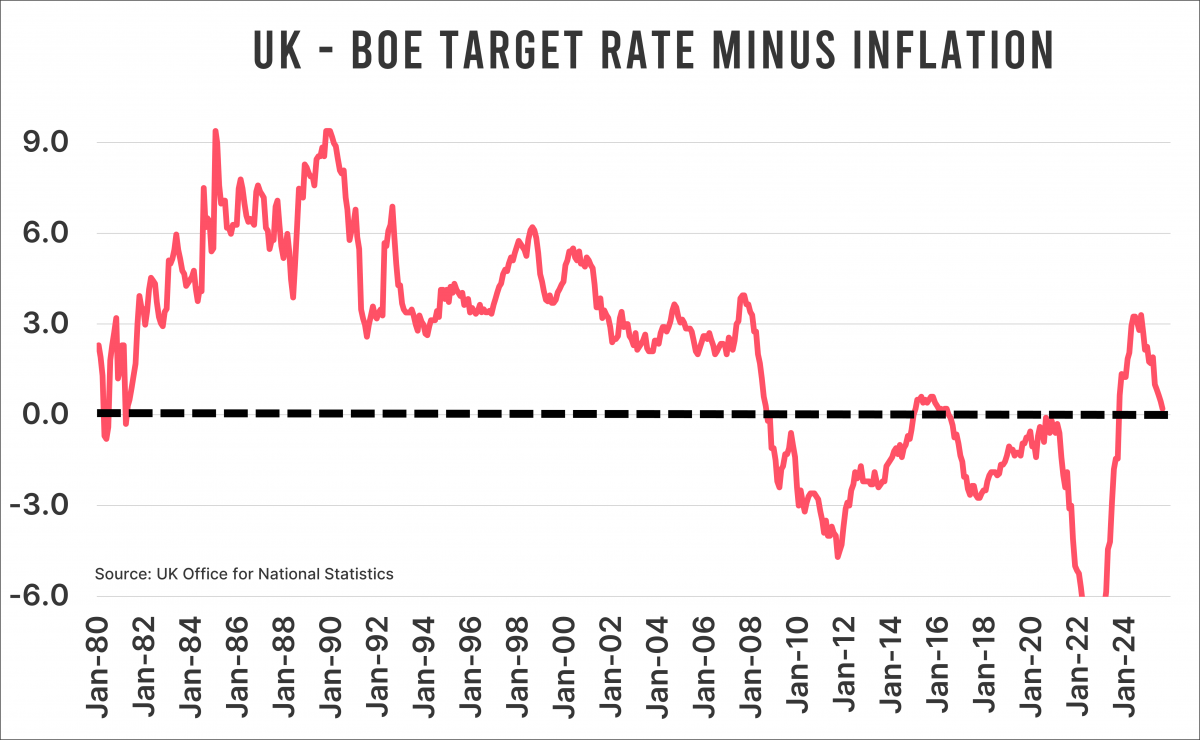
Below you see a chart showing the difference between the reported Bank of England policy rate (currently 4 percent) and headline inflation. In August, that gap was just 0.2 percent, even though inflation was clearly far too high. A gap of 0.2 percent hardly suggests the Bank of England is pushing hard to bring inflation down.
Regime shift
By directly linking the policy rate to inflation, you get a good view of the regime shift that took place after the Global Financial Crisis. Before the crisis, the Bank of England’s policy rate was significantly higher than inflation—exactly what most classical economists would expect. But after 2008, everything changed.
The era of endless “financial innovations”—to put it euphemistically—unchecked private-sector debt accumulation (remember all those fancy mortgage loans and their even fancier packaging), and excessive leverage came to an abrupt end in 2008.
Governments rushed in to fill that void, and since then it’s those governments that have been buying growth on a massive scale by issuing debt. This is why you can’t just make the one-dimensional observation that private-sector debt as a percentage of GDP has fallen. The debt has merely shifted. The consequences are different, but still profound.
Look again at the chart. Since the GFC, the Bank of England’s policy rate has almost always been lower than inflation. If that doesn’t prove a structural shift, I don’t know what does. And so, from the post-2008 perspective—when central banks seem to have taken inflation fighting a bit less seriously—you can safely argue that the UK policy rate is too high. But if you make that claim, you also have to admit that rate-sensitive investments have become structurally less attractive over the long term. That’s the part I hear mentioned a lot less often.
Jeroen Blokland analyzes striking, timely charts on financial markets and macroeconomics. He also manages the Blokland Smart Multi-Asset Fund, which invests in equities, gold, and bitcoin.