
Now that Trump has been taking things a bit easier over the past few weeks, stock valuations have become the topic dominating the markets. Market commentators are tripping over each other to declare how wildly overvalued the big tech names supposedly are. It’s a lot of parroting, really, while the actual numbers tell a more nuanced story.
Let’s start with a big disclaimer: you won’t hear me say that stocks are cheap. I didn’t say that six weeks ago either. What I will say again is that valuation is a terrible market timer.
Magnificently expensive
When people talk about equity market valuations, nine times out of ten they’re referring to the so-called astronomical valuations of the “Magnificent 7,” or whatever we’re calling them these days. Nvidia—about which many analysts have been “certain” for more than a year—added roughly a trillion dollars in market cap over the past four months. That’s, give or take, an entire AEX index plus half the bitcoin market cap. If those same analysts acted on their words, they’ve missed out on a more than 20 percent gain, even after the recent correction.
Keynes
As Keynes so eloquently put it: “Markets can remain irrational longer than you can remain solvent.” When the animal spirits fully take over, a stock market bubble can last much longer than most investors expect.
But here’s the crux: is the stock market actually in a bubble? Asking the question is almost answering it. I have my doubts—and plenty of charts to back them up. Take the one below from Goldman Sachs, for instance.
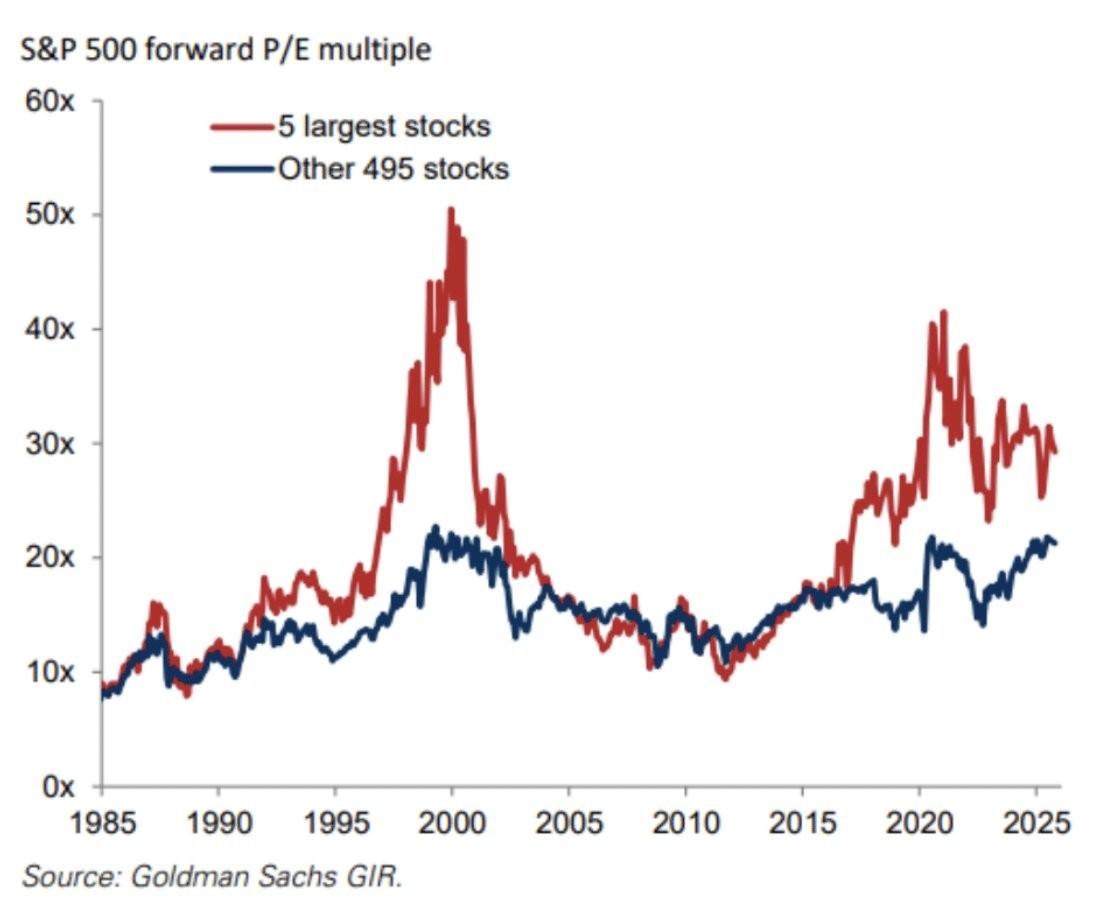
This chart compares the valuation of the five largest stocks in the S&P500 with the other 495 in the index. Rounded off a bit, those top five are about half as expensive as they were during the dot-com bubble. Their valuations have also fallen in recent years, meaning their earnings have grown faster than their share prices.
Mind the smallcaps
If you look at the blue line in the chart, you’d have to conclude that it’s mainly the smaller stocks that are pricey. The valuation of the remaining 495 stocks in the index is about the same as it was during the dot-com bubble. But a 20-times-earnings multiple doesn’t exactly make for eye-catching headlines. And even 30 times earnings for the biggest five isn’t all that outrageous.
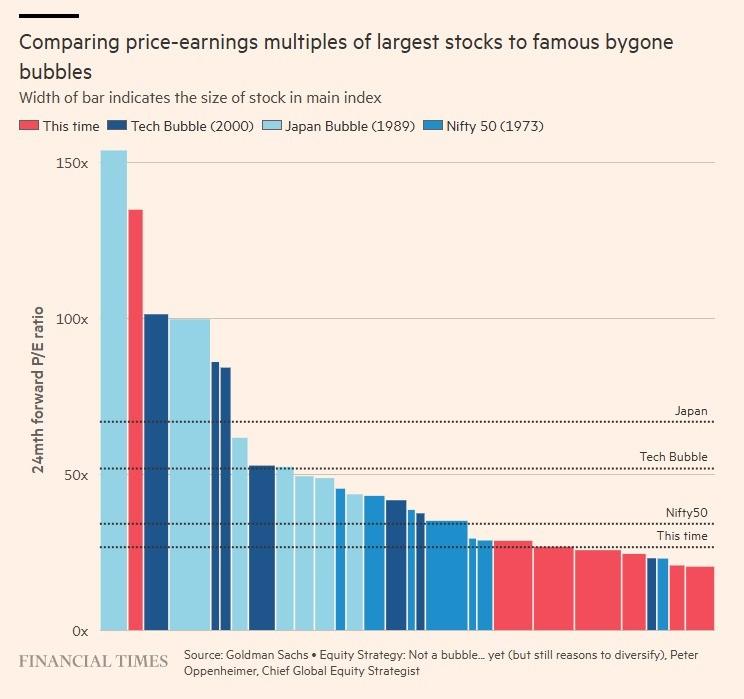
Goldman Sachs seems to have a thing for bubbles. The next chart—published by the Financial Times and also sourced from Goldman—looks at the valuation of the largest stocks in a broader context. The result, perhaps unsurprisingly, is similar: if this is a bubble, it’s more of a bubble-ette.
The interest-rate premium
Finally, stocks don’t exist in a vacuum. Compared with the dot-com era, today’s interest rates are significantly lower. That means every discounted-cash-flow model looks better now than it did back then. And, unsurprisingly, the odds are much higher that rates will remain structurally low for the foreseeable future. I suspect even Trump would agree with that.
Equity capital is scarce compared with debt capital, and things that are scarce (and useful) tend to become more expensive relative to those that are abundant. That’s Economics 101. Add it all up, and valuation—no matter how loudly the experts shout—is very unlikely to be the trigger for the next correction, which will, of course, come someday.
Jeroen Blokland analyzes striking, timely charts on financial markets and macroeconomics. He is also the manager of the Blokland Smart Multi-Asset Fund, which invests in equities, gold, and bitcoin.