
Imagine this: you predict stock returns for January 2026 using company data from all of 2026. Data that only becomes available during that year (or even afterward). Sounds absurd? Yet this is exactly the methodological foundation of one of the most cited findings in climate finance: the carbon premium.
In a 2021 paper, Bolton and Kacperczyk showed that companies with high absolute CO2 emissions achieved higher stock returns. The conclusion is clear: investors demand compensation for climate risk. Portfolio construction was adjusted accordingly, and risk frameworks were revised. But what if that premium is a statistical illusion?
A new paper by Markwat, Hanauer, and Swinkels—The Illusion of the Carbon Premium—dissects the original finding. The core of their critique is simple. Bolton and Kacperczyk use the CO2 emissions of a full calendar year to explain returns within that same year. That means emissions from November and December are used to predict returns in January. Emissions that, at that point, have not even occurred yet.
Why is that so problematic? Because estimated emissions (and a large share of the data is estimated, not reported) are typically calculated as a sector-specific carbon intensity multiplied by a company’s revenue. If you sort companies by future absolute emissions, you are in fact sorting by future revenue. And future revenue is related to stock returns. The carbon premium is therefore nothing more than a disguised revenue premium.
The authors replicate the results of Bolton and Kacperczyk when they use the same timing. But as soon as they correctly shift the emissions data (using only information actually available to investors), the premium disappears completely. Without sector effects, the coefficients are insignificant. When using only reported emissions instead of estimated ones, the picture becomes even clearer: there is no positive relationship.
But The Illusion of the Carbon Premium goes beyond simply debunking the carbon premium. When “greenness” is measured using carbon intensity (for example, emissions per unit of revenue, a metric that neutralizes the revenue effect), green companies actually outperform brown ones. Over the period 2010–2025, a “green minus brown” factor delivers a significantly positive return, even after adjusting for common risk factors. Even the energy rally during the Russia–Ukraine war did not structurally disrupt this pattern.
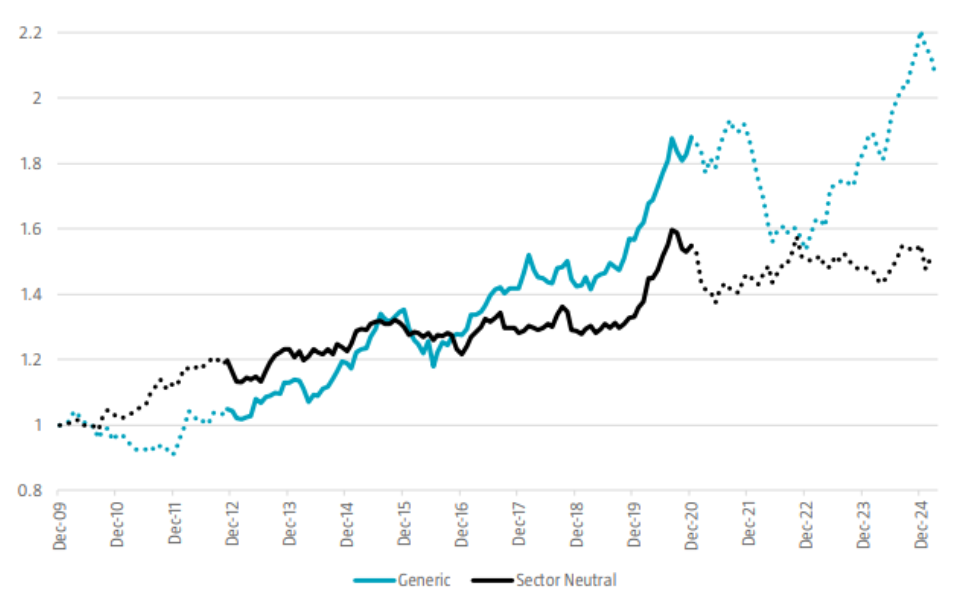
Figure: cumulative returns of “green minus brown”
What does this mean for practice?
- Be critical of any research that uses specific data to explain historical returns. The look-ahead bias in climate finance is not a subtle methodological detail; it is the determining factor behind the reported carbon premium.
- Carbon intensity is a better metric than absolute emissions for assessing the “greenness” of a portfolio.
- The evidence points more toward a green advantage than a brown premium.
The carbon premium was an elegant story. But elegance is no substitute for methodology. For investors who based their climate strategy on the idea that brown stocks structurally deliver higher returns, it is time to reconsider that assumption. The premium never existed. Only the illusion.
Gertjan Verdickt is assistant professor in finance at the University of Auckland and a columnist at Investment Officer.