Our valuation tracker is a tool that shows how major global equity indices are valued across key financial metrics, which we update quarterly. We have built a table that shows you how these metrics are valued on equity indices worldwide.
To help interpret the data, we spoke with our investment experts to explore the key opportunities and risks across global markets.
Valuation Tracker Interactive Map: P/E ratio map of stock markets around the world
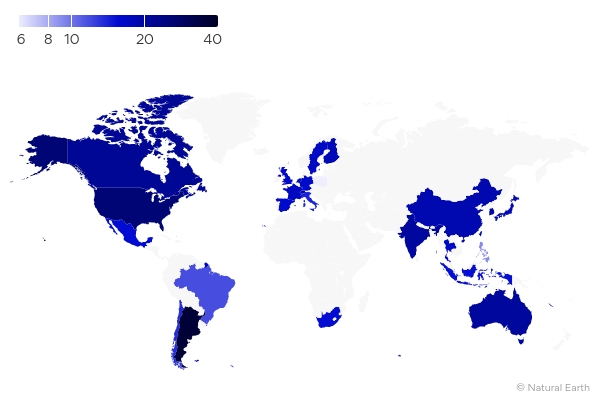
Source: Bloomberg as at 31 Mar 2026
Views from the UK & European Equities team
- UK equities offer exposure to many high-quality, cash-generative companies trading at valuations below global peers, even after taking account of differences in return-on-capital. They offer compelling income streams and capital growth that can provide a valuable defence against inflation.
- Sector exposures are very different from other global equity markets, bringing additional diversification benefits.
- Political instability is potentially a near-term risk to UK economics, but the UK stock market is highly international, approximately 80% of FTSE100 revenues come from outside the UK and so the domestic picture is less relevant.
- Additional risks include the growth of protectionism and other geopolitical events, such as the conflict in the Middle East that have the potential to spark a prolonged global recession.
Views from the European team
- Interest in Europe has been turning more positive as investors question the end of US exceptionalism and various significant, pro-active European fiscal developments driving a pick-up in regional growth expectations.
- While valuations across European markets have broadly responded positively to this shift, there are still some extremely interesting valuations both at the sector and individual company level, which a fundamentals-based stock picking approach can exploit.
- We look for opportunities where positive change has been mispriced by the market and, while we manage balanced portfolios across all sectors, we see excellent long-term return potential in areas including basic materials, energy, utilities, and banks.
- The key risk is of a potential long-term increase in energy prices as a consequence of the conflict in the Middle East and which could drive a global recession.
- However, Europe as a region is in a far stronger position today relative to other regions than it has been since the Global Financial Crisis — there is fiscal support and room for further fiscal expansion, household balance sheets are also strong and there has been a pickup in investment activity.
Views from the Asia and Emerging Markets Equities team
- Over the past year, emerging market (EM) equities have rebounded strongly from depressed levels. While, in aggregate, EM remains attractively valued relative to developed markets, valuation dispersion across countries and sectors is stark, reinforcing the importance of stock selection.
- India continues to trade at a premium, reflecting strong domestic demand, a sustained capital expenditure cycle, and high investor confidence.
- By contrast, China still trades at a meaningful discount, largely due to ongoing concerns around the property sector, regulatory uncertainty, and subdued consumer sentiment. Coordinated government measures in China have helped stabilize the economy, and we believe that further efforts to boost domestic consumption will be supportive of valuations and performance.
- In South Korea — one of the best‑performing markets in 2025 — there are still several attractively valued companies. However, rising valuations at the broader market level warrants some caution. A similar dynamic applies to Asian semiconductors: while we retain significant holdings in high‑quality industry leaders, strong performance has left valuations more demanding, prompting us to trim positions.
- We believe valuations remain particularly attractive in Latin America, where markets trade below historical averages and offer compelling dividend yields. We are also constructive on commodities, an area that until recently was largely overlooked by investors and continues to offer some favorable valuations.
- One area that underperformed in 2025 was the so‑called “quality” segment of the market. While definitions of quality vary and we do not invest with a factor lens, many of the attractively valued opportunities we are currently identifying would historically have fallen into this category. These include businesses in consumer staples, health care, IT services, and selected leisure industries, where solid fundamentals contrast with valuations that remain depressed relative to their long‑term potential.
Views from the Global Equities team
- The key advantage of investing globally is the breadth of the opportunity set. For active managers, there is an enviable choice of stocks across sectors and geographies. At any given time, there will always be areas of the market that are out of favour.
- We can exploit this by finding those companies where sentiment is against them in the short term, perhaps for geopolitical reasons, but the long-term fundamentals of the business remain intact.
- Investing globally can also help manage risk. Some regional markets are more exposed to specific sectors or industries. By investing globally, we can ensure that we can manage style and factor risks to ensure a diversified portfolio.
- Even within a global portfolio, you can still be exposed to themes or market fads. By focusing on valuation and employing a range of risk management tools, such as correlation analysis, we can offset these risks.
Valuation Tracker Table: Financial metrics of stock markets around the world
| Index | Country | P/E Ratio | P/B Ratio | Dividend Yield | Free Cash Flow Yield |
|---|---|---|---|---|---|
| US & Canada | |||||
| S&P/TSX COMPOSITE INDEX | Canada | 21.53 | 2.60 | 2.53 | 4.31 |
| S&P 500 INDEX | United States of America | 25.55 | 5.09 | 1.30 | 2.95 |
| Europe | |||||
| OMX HELSINKI BENCHMARK | Finland | 17.63 | 2.14 | 4.12 | 5.24 |
| CAC 40 INDEX | France | 16.97 | 2.01 | 3.42 | 5.30 |
| DAX INDEX | Germany | 16.17 | 1.88 | 3.05 | 6.88 |
| FTSE MIB INDEX | Italy | 14.02 | 1.75 | 5.02 | 6.02 |
| AEX-Index | Netherlands | 18.45 | 2.49 | 2.87 | 5.15 |
| WSE WIG INDEX | Poland | 6.03 | 1.68 | 4.55 | 7.16 |
| IBEX 35 INDEX | Spain | 15.96 | 2.12 | 4.13 | 5.07 |
| OMX Stockholm All-Share | Sweden | 16.84 | 2.12 | 2.94 | 4.30 |
| SWISS MARKET INDEX | Switzerland | 18.98 | 4.20 | 3.17 | 6.60 |
| FTSE 100 INDEX | United Kingdom | 16.27 | 2.29 | 3.45 | 5.26 |
| Asia | |||||
| SHANGHAI SE COMPOSITE | China | 18.60 | 1.53 | 2.55 | 4.49 |
| S&P BSE SENSEX INDEX | India | 20.44 | 3.07 | 1.68 | 3.31 |
| JAKARTA COMPOSITE INDEX | Indonesia | 15.18 | 1.86 | 5.77 | 3.60 |
| TOPIX INDEX (TOKYO) | Japan | 17.92 | 1.66 | 2.45 | 3.61 |
| PSEi - PHILIPPINE SE IDX | Philippines | 9.16 | 1.20 | 3.74 | 5.11 |
| Straits Times Index STI | Singapore | 16.81 | 1.56 | 4.61 | 5.03 |
| KOSPI INDEX | South Korea | 19.07 | 1.55 | 1.72 | 2.36 |
| TAIWAN TAIEX INDEX | Taiwan | 24.47 | 3.09 | 2.60 | 2.61 |
| STOCK EXCH OF THAI INDEX | Thailand | 16.40 | 1.37 | 3.85 | 8.19 |
| Oceania | |||||
| S&P/ASX 200 INDEX | Australia | 20.66 | 2.38 | 3.84 | 4.20 |
| Latin America | |||||
| MSCI ARGENTINA | Argentina | 35.98 | 1.18 | 23.55 | -3.30 |
| MSCI BRAZIL | Brazil | 11.71 | 2.12 | 5.59 | 4.25 |
| MSCI CHILE | Chile | 13.44 | 1.75 | 3.37 | 6.08 |
| MSCI MEXICO | Mexico | 15.43 | 2.36 | 4.70 | 6.29 |
| South Africa | |||||
| FTSE/JSE AFRICA ALL SHR | South Africa | 15.38 | 2.10 | 3.58 | 5.69 |
Source: Bloomberg as at 31 Mar 2026
The stock market indices used were as follows: United States of America = S&P 500; Canada = S&P/TSX Composite; France = CAC 40; Germany = DAX; Spain = IBEX 35; Switzerland = SMI; Netherlands = AEX-Index; United Kingdom = FTSE100; Italy = FTSE MIB; Poland = WSE WIG Index; Finland = OMX Helsinki Benchmark; Sweden = OMX Stockholm All-Share; China = Shanghai SE Composite; Singapore = STI; Taiwain = Taiwan Taiex; South Korea = KOSPI; Indonesia = Jakarta Composite; Philippines = Philippine SE; Thailand = Stock Exchange of Thailaind; India = Sensex; Australia = S&P/ASX 200; Japan = Topix; Mexico = MSCI Mexico; Brazil = MSCI Brazil; Argentina = MSCI Argentina; Chile = MSCI Chile; South Africa = FTSE/JSE Africa All Share; Russia = MOEX Russia.
Investment risks
The value of investments and any income will fluctuate (this may partly be the result of exchange rate fluctuations) and investors may not get back the full amount invested.
Important information
Data as at 31 March 2026
This is marketing material and not financial advice. It is not intended as a recommendation to buy or sell any particular asset class, security or strategy. Regulatory requirements that require impartiality of investment/investment strategy recommendations are therefore not applicable nor are any prohibitions to trade before publication. Views and opinions are based on current market conditions and are subject to change.
EMEA5387820/2026